
Are SAU39 Students Getting Our Money's Worth?
- May 16
- 6 min read
In March of this year, Superintendent Mike Berry published a brief update on SAU39 educational performance. He again committed to increasing educational performance and maximizing taxpayer return on investment. That relationship between educational performance (outcomes) and taxes paid for education (investment) is known as Educational Value.
We thought we'd take a closer look at both sides of that equation. Superintendent Berry compared SAU39 to state averages. Given the very high annual investment we make in education, we compare our academic performance with other local school systems that, as expected, consistently exceed the state average.
There is no single calculation through which one divides academic outcomes by expended cost to arrive at a hard number. Rather, it’s a process of gaining a good sense of academic outcomes achieved within a school, district or SAU; comparing them with those of comparable organizations; and making a general determination of where we fall on the spectrum of value.
This article explores the educational value SAU39 students and taxpayers derive and weighs how we fare with peer communities.
The Comparison Set
To create a solid foundation for our analysis, we’ve selected SAU's and their respective districts and schools that our SAU administration has acknowledged represent valid candidates for academic and cost comparisons. They include:

For academic outcomes and cost comparisons, we’ve used data compiled by the NH Department of Education (NHDOE), all of which were submitted by each of the respective SAU's.
Comparing Educational Performance
For this overview article, we draw on NH-DOE data covering ELA (English Language Arts), Math, and Science for various SAU's, districts, and schools over a series of years.
English Language Arts (ELA) Proficiency
ELA proficiency data for all schools in our sample set runs from 2018 (pre-COVID) through 2025. ASD, Mont Vernon, and Souhegan schools are highlighted in color.
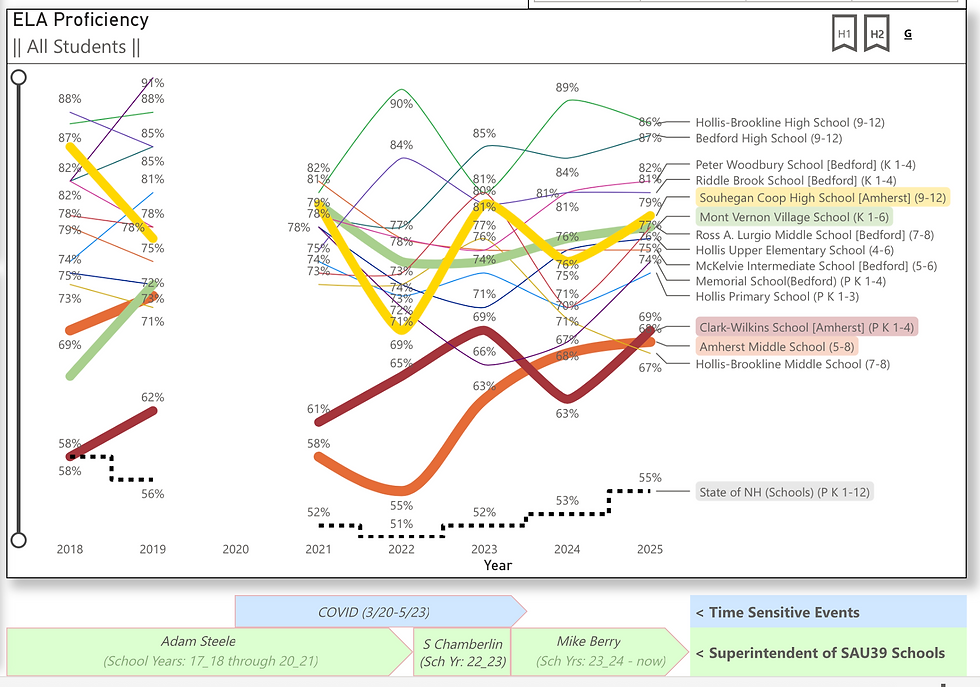
Highlights:
· All schools in this sample performed better than the state average (except for Clark-Wilkins in 2018).
· In 2018, Mont Vernon Village School was at 65% proficiency and increased to 73% in 2019. Even after COVID, they achieved 78% proficiency and have remained somewhat steady in their ELA outcomes since. Notice, though that Bedford elementary schools still outperform Mont Vernon.
· Clark-Wilkins was achieving ELA proficiency only equal to the state average in 2018 and has attained a high of 69% proficiency most recently. That is significantly below the outcomes attained by other elementary schools in the mix. It also indicates that Amherst students heading into Amherst Middle School (AMS) have not demonstrated the same proficiency as Mont Vernon students heading into AMS.
· In 2018, 69% of AMS students were proficient in ELA. Post-COVID, AMS has yet to recover to its pre-COVID level and is second from the bottom in its current proficiency score. This indicates that both Mont Vernon and Wilkins students experience a degradation in their ELA scores at AMS.
· Pre-COVID, Souhegan High School enjoyed an 85% level of proficiency in ELA but experienced a steep drop the following year. Post-COVID, Souhegan has seen notable fluctuations in ELA proficiency and remains nearly 10 points below Bedford and Hollis-Brookline.
· Students in the Bedford and Hollis systems seem get off to a stronger start in ELA and persist with higher ELA proficiency scores throughout their public-school education.
Math Proficiency

· All schools in this sample have consistently performed better than the state average, except for Souhegan, which is generally trending downward.
· Pre-COVID, Mont Vernon's proficiency scores were only 50%. Notably, post-COVID, they made a major steady year-to-year recovery – going from 70% proficiency in 2021 to 85%; outpacing most other schools.
· Clark-Wilkins went from 67% proficiency in 2018 to 61% pre-COVID and has pretty steadily improved to 76% and is keeping good company with other elementary schools in the sample.
· Pre-COVID, AMS's proficiency scores climbed from 69% to 71%. However, scores nose-dived to 43% post-COVID before rebounding significantly in 2024-25 to 68%; recovering nearly all the COVID-induced loss.
· The level and volatility of Souhegan's math proficiency scores are alarming. Its proficiency scores pre-COVID were at 62%. Since then, scores have plummeted into the low 40's, and most recently below the state average. This means that many students matriculating into Souhegan see their math proficiency decline instead of being completed on a higher trajectory.
Science Proficiency

· Pre-COVID, science proficiency at Mont Vernon was sliding into the low 50's. Post-COVID, the school picked up where it had left off but made significant strides, so that it now outpaces all but one of the peer schools.
· Conversely, AMS saw science proficiency ratings in the 60's pre-COVID. However, since COVID, AMS scores have cratered into the 40's and have not rebounded.
· Souhegan's science proficiency scores have been in the high 50's with a notable drop in 2024 to 45% before rebounding.
Proficiency performance across SAU39 ELA, Math, and Science often lags behind that of the other comparable SAU's. It is also important to note how volatile academic performance is across – even within – SAU39 schools. Ideally, academic performance should be higher and much more stable.
Comparing Costs
Amherst residents invest upwards of $300,000 per child to provide a public K-12 education. Of the total annual taxes paid by Amherst resident, about 25% go to municipal/county government, and about 75% go to our schools.
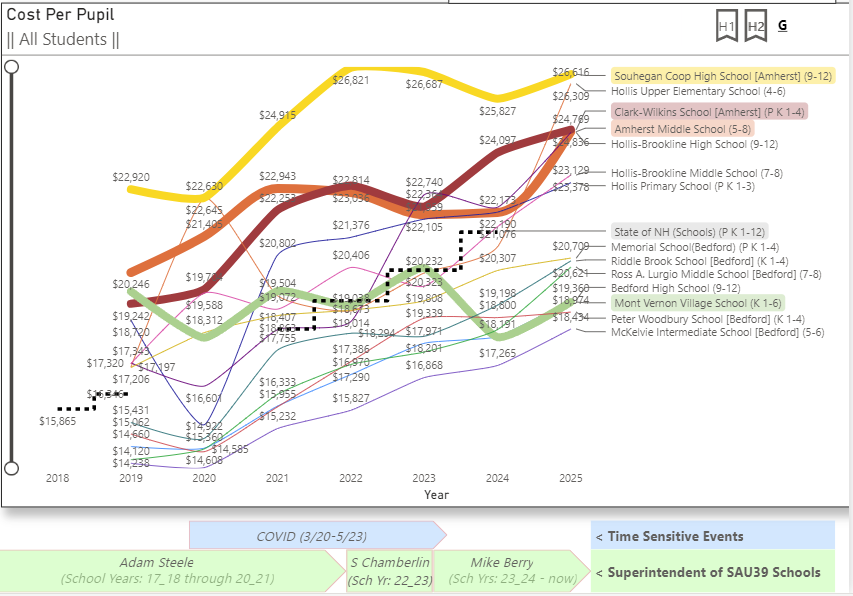
· The cost-per-pupil (CPP) at the Mont Vernon Village School has remained stable and on the lower side compared to other schools.
· In 2019, the CPP for Clark-Wilkins was comparable to that of Mont Vernon (about $20K). Since then, however, it has ballooned to $24.8K – almost $6K more per student per year in 2025.
· AMS's CPP growth has closely tracked that of Clark-Wilkins and now outpaces most of the other middle schools.
· Souhegan had a CPP of about $23K in 2019 but has ballooned to $26.6K per student in 2025. That is the highest CPP of any school in the sample set.
SAU39 (Mont Vernon, Amherst, and Souhegan) and SAU41 (Hollis-Brookline) are comparable in terms of socioeconomics, student populations, and number of school buildings managed. What's important to note is that, if SAU39 were operating as cost efficiently as SAU41, Amherst taxpayers would be spending $2.1 million less per year than they are currently.
Similarly, within SAU39, if Clark-Wilkins were operating as cost efficiently as the Mont Vernon Village School, Amherst taxpayers would be paying over $3.7 million less per year than they are currently.
Assessing Educational Value
In considering the tradeoff of costs invested to obtain good educational outcomes, the ideal would be to have a low expenditure in taxes contributing to high educational outcomes for students. However, that is not what we see for our Amherst-based SAU39 schools (Mont Vernon being the exception).
Below are several bubble charts that depict educational value of SAU39 schools for ELA, Math, and Science. The size of the bubble for each school indicates the relative size of the school's enrollment. The x-axis for each chart covers CPP (high-to-low), and the y-axis covers the percent of students proficient in the subject.
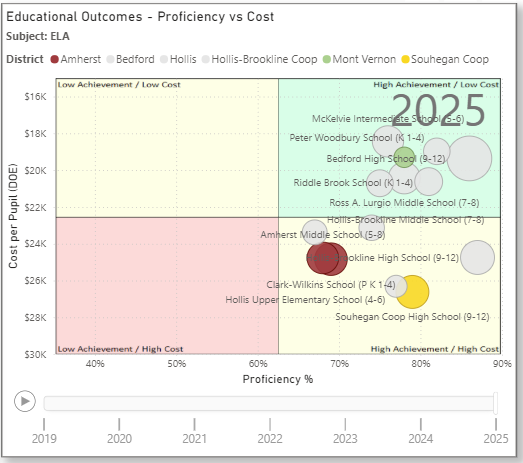
· Mont Vernon delivers high value in ELA (high proficiency at lower cost).
· Clark-Wilkins and AMS deliver lower educational value in ELA (lower achievement at higher cost).
· Souhegan delivers higher outcomes in ELA but at higher cost.
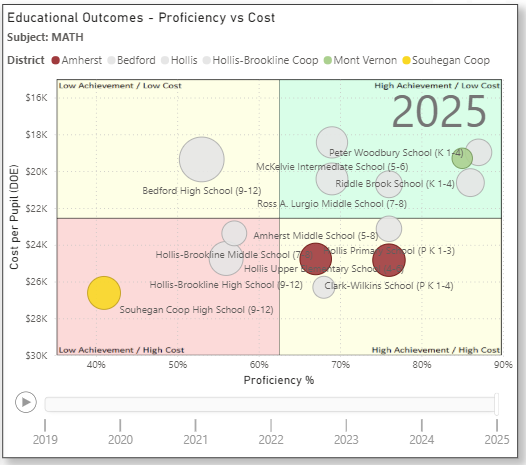
· In Math, Mont Vernon delivers very high academic outcomes at very low cost, i.e., high educational value.
· Clark-Wilkins delivers moderately high math outcomes for high cost.
· AMS delivers modest outcomes at high cost.
· Souhegan delivers the lowest Math outcomes for the highest cost i.e., lowest educational value.

· We note that, overall, science outcomes are lower than ELA and Math for all schools, with the highest proficiency percent being around 66%.
· Mont Vernon attains the second highest proficiency outcomes of all schools, and at a low cost.
· AMS elicits modest outcomes for high cost.
· Souhegan achieves moderately high outcomes, but at a high cost.
Excepting Mont Vernon, NH-DOE data clearly shows SAU39 academic proficiency is lower than most comparable ‘peer’ schools, and SAU39's Cost per Pupil exceeds that of comparable ‘peer’ schools. This means that Hollis-Brookline and Bedford enjoy a higher return on the taxes invested in their schools than does SAU39. This raises key questions:
· Why does it cost so much more to educate a student in Amherst than it does in Hollis-Brookline or Bedford?
· How do those SAU's achieve higher outcomes, often at lower costs?
· What contributes to the volatility of the educational outcomes that SAU39 students experience across their stint in public-school?
What is Mont Vernon doing – within our own SAU – to attain such high academic outcomes at such a reasonable investment, and how may the Amherst School District and the Souhegan District adopt them?


Comments